Figure caption of Age of branch based on STR-values
This is the diagram that is the result of the data collection and analysis that is described in Data section of this website.
Example of figure
Each person that is measured with at least 67 markers gives one element in the diagram with the following characteristics:
- A genetic STR distance to the modal of the group (# of unequal markers to MRCA).
- A country of origin (as reported by the person).
The following values are reported:
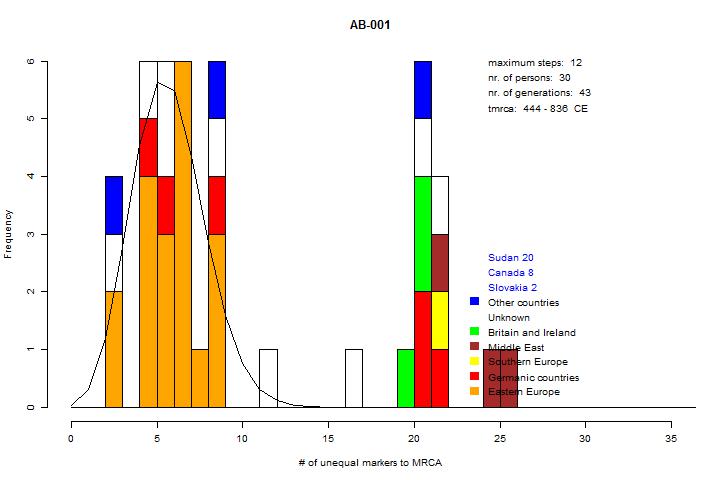
- horizontal axis: genetic distance (GD) in # of unequal markers to MRCA (marker mutations since the most recent common ancestor.
- vertical axis: number of people with that GD (Frequency).
- colour: the number of people are grouped in countries of origin as reported in the Data section.
For the large Ashkenazi groups one can see in general a large group with orange (Eastern Europe) and a small group with red (Germanic countries) near the expected number of marker mutations. Further away (with typical Genetic Distance above 10) one can see people with a larger GD. These people have a shared ancestor that is (on average) longer ago.
- the line represents the distribution of expected GD according to the best estimated nr. of generations.
- maximum steps: this is the GD-value that is used as a condition to consider the person in the Jewish group or outside the Jewish group. If the GD is less, the person is considered a very likely member of the group and the data is used in the best-fit calculation.
- nr. of persons: this is the number of persons that follow the requirements (67 markers measured, public reported and within the maximum of steps).
- nr. of generations: this is the number of generations for the best fit.
- tmrca: this is the 95%-range of the possible time to the most recent common ancestor of the group as described in the Data page. The time is expressed in CE (Common Era).